


Create usage metrics
Contents
Customer Analytics is currently in beta and free to use. We're actively developing this feature and would love your feedback.
You can create usage metrics in two ways:
- Go to Settings > Customer Analytics and click Add usage metric
- Open any customer profile and click Add usage metric
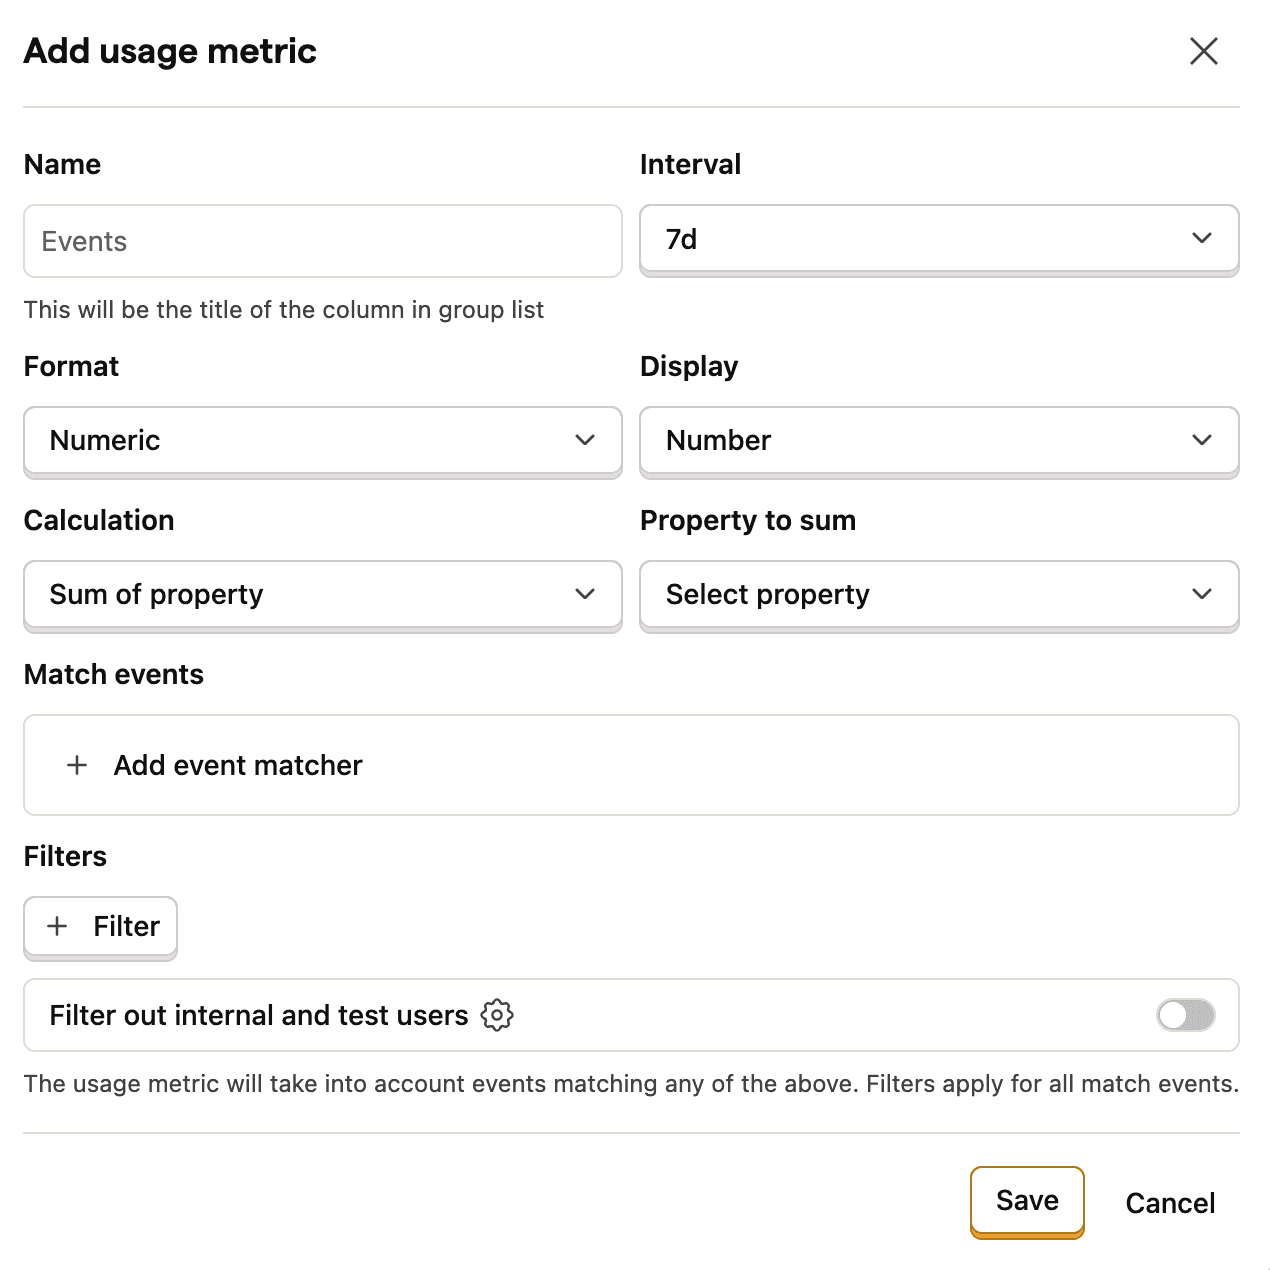
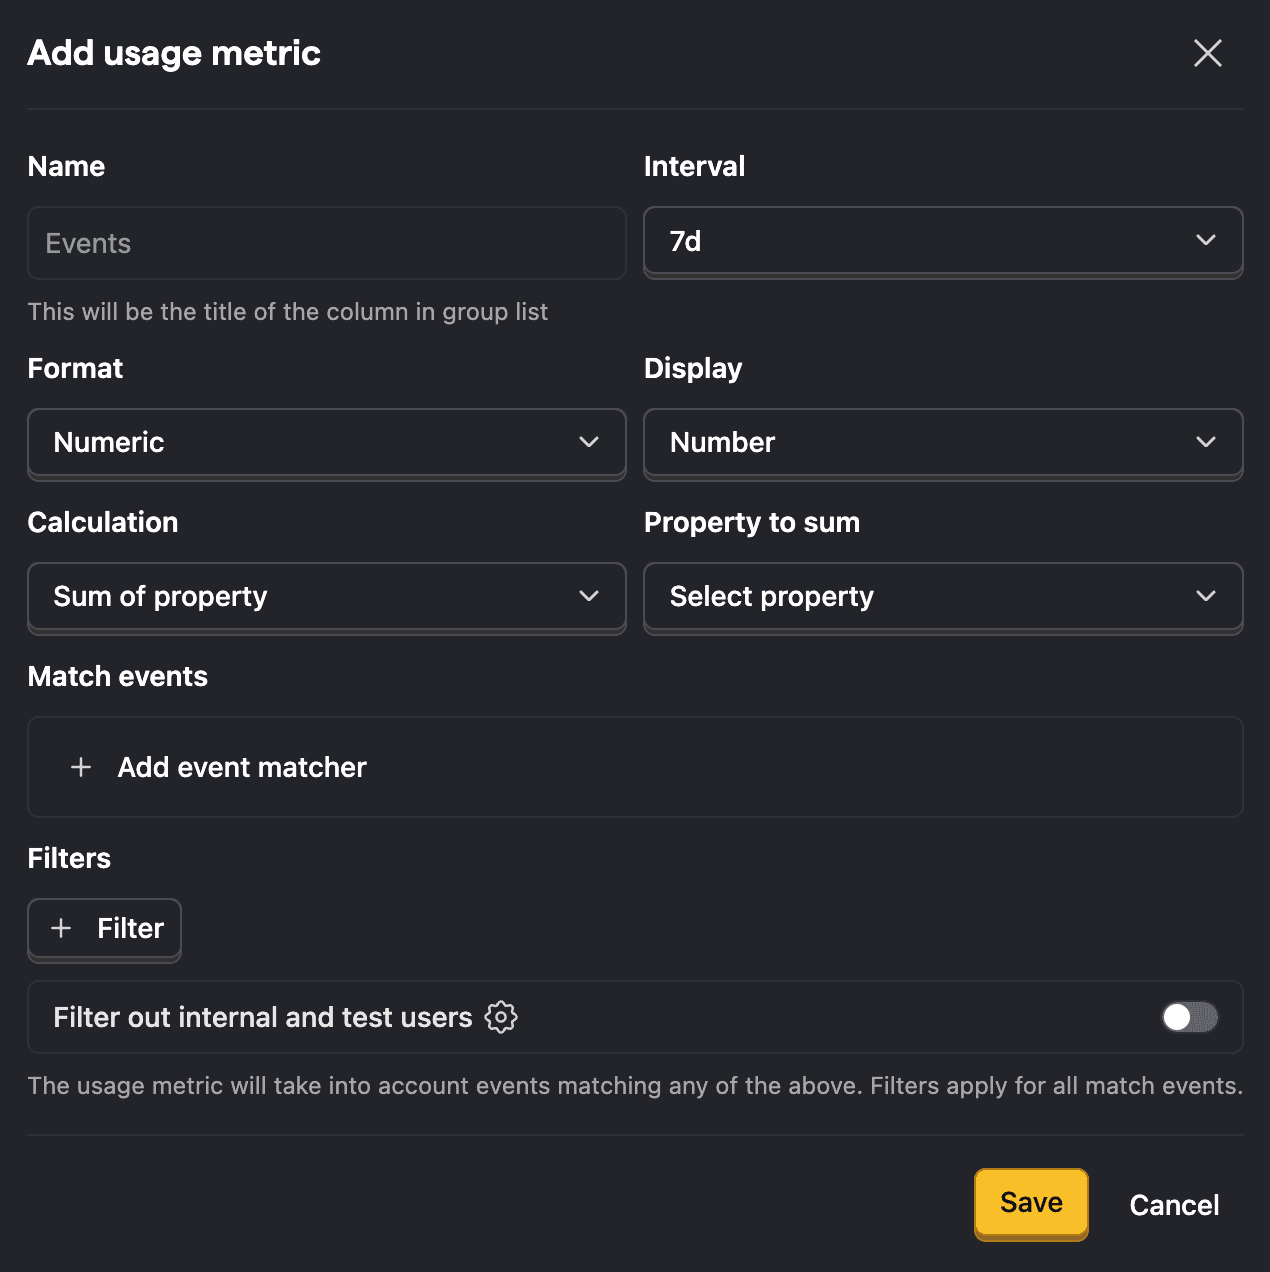
Configuration options
| Field | Description |
|---|---|
| Name | The column title shown in customer lists |
| Interval | Time period for the metric: 7, 30 or 90 days |
| Format | How the value should be formatted: Numeric or currency |
| Display | How the metric is visualized: Number (default) or Sparkline |
| Calculation | How data is aggregated: Count of events/rows (default) or Sum of property/column |
| Property to sum | The numeric property or column to sum. Only shown when Calculation is set to Sum |
| Match events | Which events or Data Warehouse table to use as the metric source |
| Filters | Additional conditions to narrow down matched events (events source only) |
Match events or Data Warehouse table
Click Match event or Data Warehouse table to specify the source for this metric.
For events-based metrics, you can add multiple event matchers. The metric counts events matching any of them. For example, to track API usage, you might match events named api_request or api_call.
For Data Warehouse metrics, select a Data Warehouse table and configure:
- Timestamp column – The column used to filter rows by the metric's date range
- Group key column – The column used to match rows to the correct customer
Each metric uses a single source. You can't mix events and Data Warehouse tables in the same metric.
Data Warehouse usage metrics currently only render on group profiles, not person profiles.
Filters
Filters apply to all matched events and are only available for events-based metrics. Use them to narrow down what counts – for example, only counting successful API calls by filtering for status = 200.
Calculation
Choose how data is aggregated for the metric:
- Count of events (or Count of rows for Data Warehouse) – Counts the total number of matched events or rows. This is the default.
- Sum of property (or Sum of column for Data Warehouse) – Sums the values of a numeric event property or table column across matched data. When selected, a Property to sum (or Column to sum) field appears where you select the value to aggregate. This is useful for tracking cumulative values like API tokens consumed, storage used, or revenue generated.
Display
Choose how the metric is visualized on customer profiles:
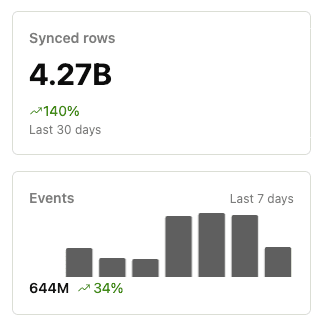
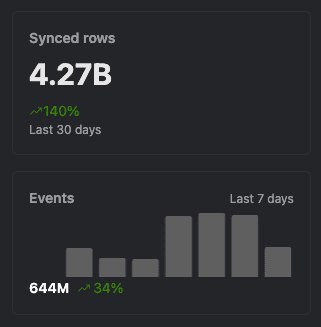
- Number – Shows a single numeric value with a percentage change indicator. This is the default.
- Sparkline – Shows a bar chart of daily values over the selected interval, along with the total value and percentage change. Useful for spotting trends at a glance.
Manage usage metrics via MCP
The PostHog MCP server enables AI agents to programmatically manage usage metrics. You can create, update, list, and delete usage metrics directly from any MCP client like Cursor, Claude Code, or VS Code.
The following MCP tools are available for usage metrics:
| Tool | Description |
|---|---|
usage-metrics-create | Create a new usage metric |
usage-metrics-list | List all usage metrics in the project |
usage-metrics-retrieve | Get a single usage metric by ID |
usage-metrics-partial-update | Update an existing usage metric |
usage-metrics-destroy | Delete a usage metric |
Try these example prompts with your MCP-enabled agent:
List all usage metrics in my project.Create a usage metric that counts api_request events over the last 30 days.Update my API calls metric to use a 90-day interval.Delete the usage metric with ID 123.
See the MCP server documentation for setup instructions.